
The Relationship between Search Volume and Disc Golf Growth
How trends in the volume of Google searches relate to trends in the number of disc golf participants

In Analyzing Other Metrics for Disc Golf Growth, I analyzed how well trends in the number of disc golf courses, the number of PDGA active members, and the number of rounds recorded on UDisc reflected trends in disc golf growth (the number of participants in disc golf, i.e., the number of people who have played disc golf at least once in the past year), and concluded that, of the three, the number of PDGA active members was probably the most reflective of short-term changes in the number of participants, although perhaps with a bit of a lag. In this post, I analyze how trends in the volume of Google searches that include terms for disc golf (which are charted in Trends in US Searches for Disc Golf and Trends in Worldwide Searches for Disc Golf for the US and worldwide, respectively) may relate to trends in the number of disc golf participants.
Set forth below is a chart that shows both the volume of Google searches worldwide that included terms for disc golf from 2010 to 2024 (left scale, with the numbers being the percentage that the average monthly search volume during a year for searches that included any of the top 5 terms for disc golf represented of the all-time highest monthly search volume for any of the terms during 2010-2024 (which happened to be “disc golf” in July 2021)) and the number of PDGA active members from 2010 to 2023 (right scale).
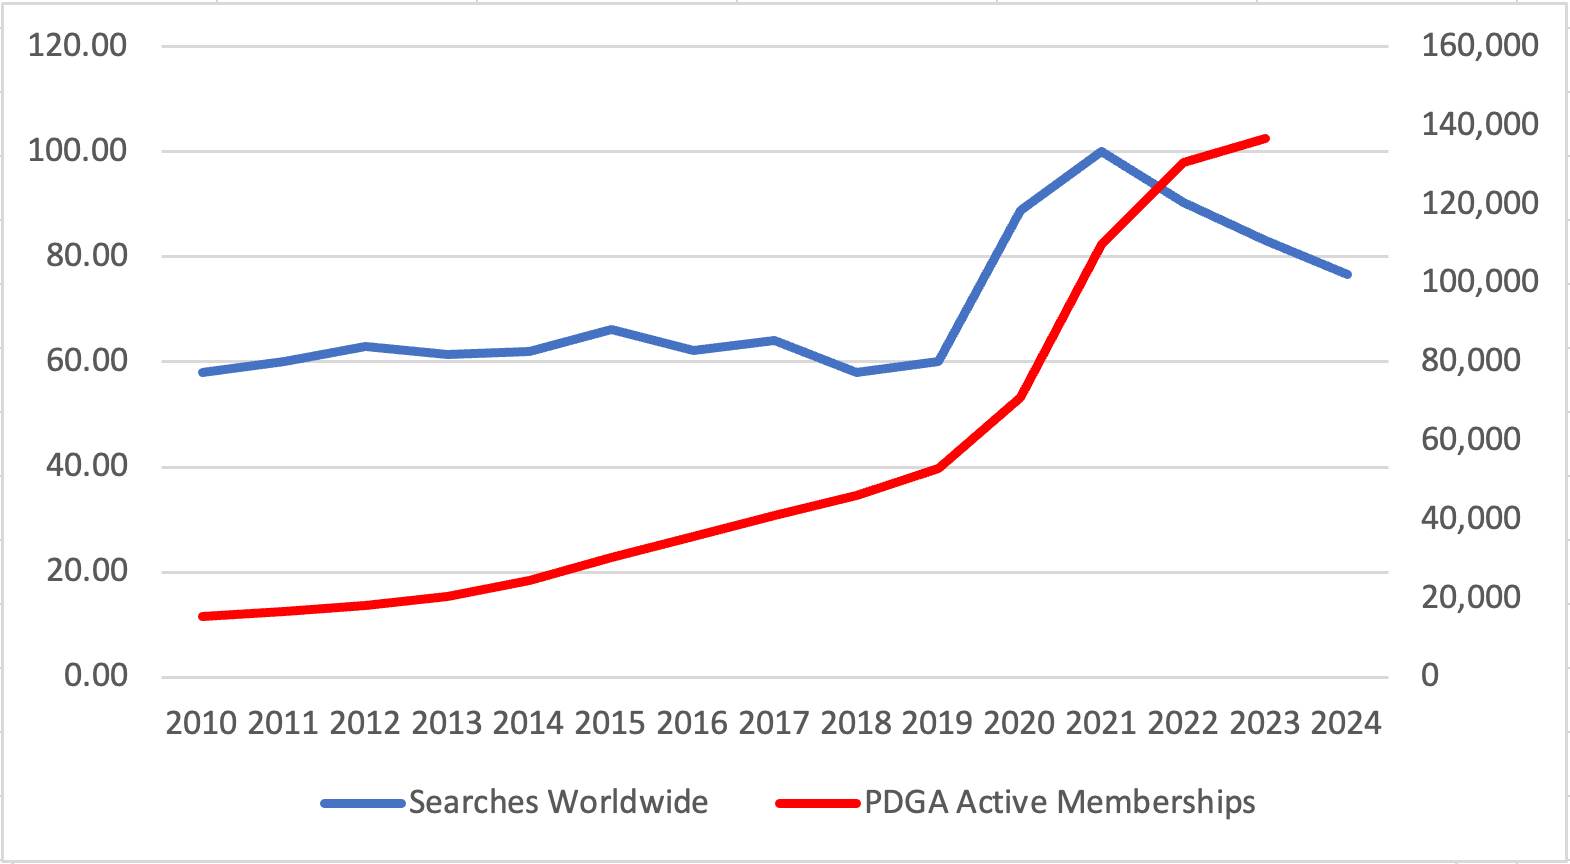
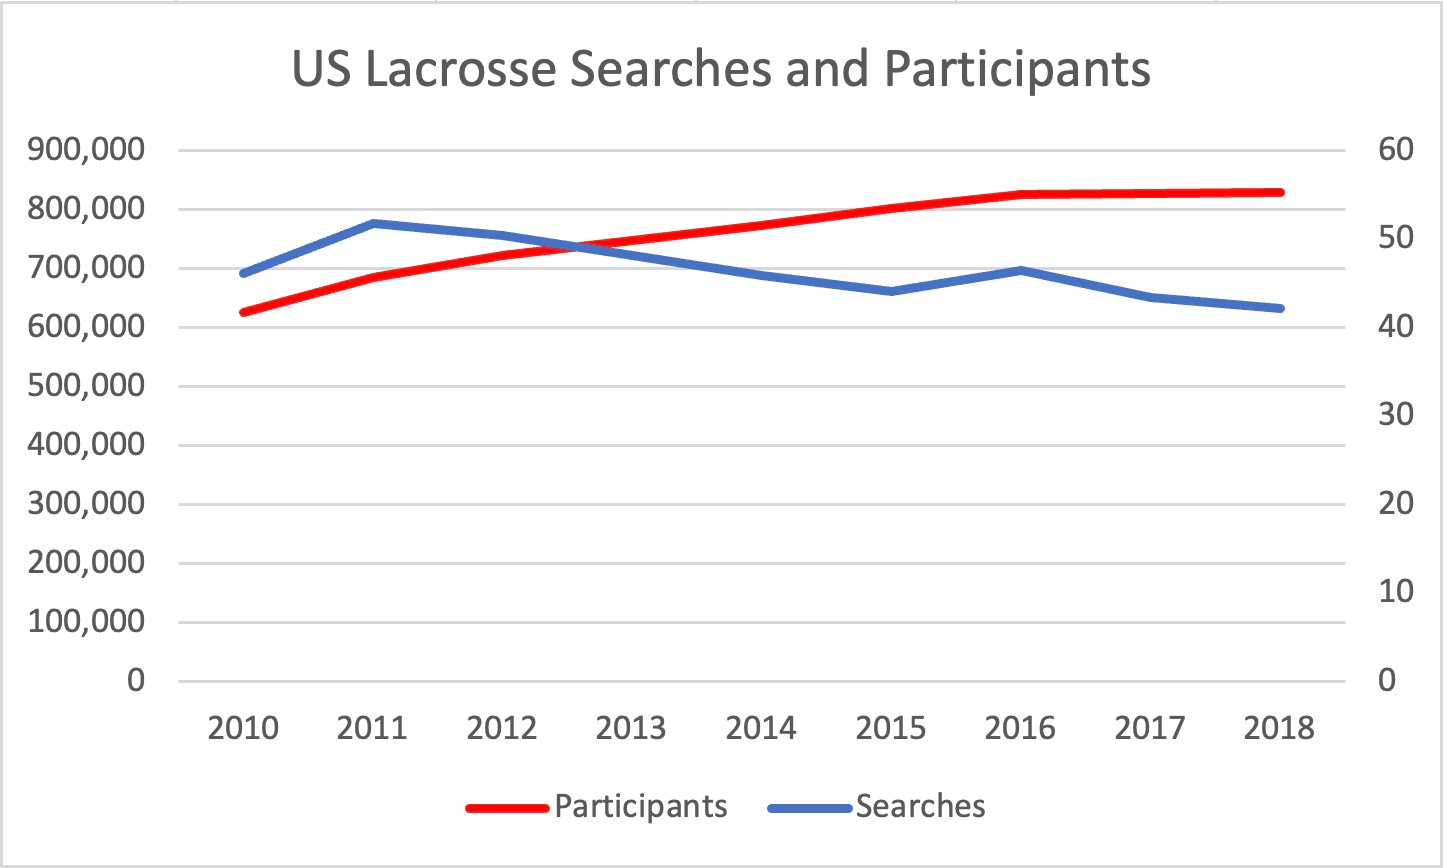
A couple of differences in the trend lines stand out. First, while the number of PDGA active members gradually increased from 2010 to 2019, the volume of Google searches worldwide that included terms for disc golf was essentially flat during that time period. If we assume that the trend in the number of PDGA active members roughly corresponds (albeit with perhaps a bit of a lag) to the trend in the number of disc golf participants, this could either mean that (1) the volume of Google searches that included terms for disc golf worldwide does not reflect the number of disc golf participants or (2) a steady volume of Google searches worldwide that included terms for disc golf is consistent with a steady increase in the number of disc golf participants. I believe the latter is true. As was discussed in Trends in US Searches for Disc Golf, the number provided by Google Trends for the volume of Google searches that included a term during any time period is based on the percentage of times that term shows up in random samples of Google searches during that time period - i.e., the number is relative to the total number of Google searches. That means that if the number provided by Google Trends for the volume of Google searches for a term is flat, the absolute number of Google searches that included that term is increasing at the same rate Google searches in general are increasing. As it turns out, the overall volume of Google searches probably more than doubled from 2010 to 2019,1 which means that, since the number provided by Google Trends for the volume of Google searches that included a term for disc golf was flat during that period, the absolute number of Google searches for terms for disc golf probably also doubled. The assertion that participation in a sport can increase substantially during a period when the numbers provided by Google Trends for the volume of Google searches for that sport are flat or even slightly down is also supported by real-world examples. As one example, as shown in the chart below, the numbers provided by Google Trends for the volume of searches in the US that included the word “lacrosse” (right scale, with 100 being the maximum monthly volume of searches) show a gradual decline during 2010 to 2018, while the number of US participants in lacrosse (left scale, source statista.com2) gradually increased.
The second difference between the trendlines for the volume of Google searches worldwide that included terms for disc golf and for the number of PDGA active members, is in the period from 2019 to 2023, where increases in the volume of searches from 2019 to 2020 and from 2020 to 2021 corresponded to increases in the rate of growth in the number of PDGA active members, while from 2021 to 2022 and from 2022 to 2023 the volume of searches decreased but the rate of growth in the number of PDGA active members just slowed down.
From the behaviors discussed above, it seems that the volume of Google searches that included terms for disc golf is highly correlated with, not the number of PDGA active members, but the rate of growth in the number of PDGA active members. If Google search volume was highly correlated with the number of PDGA active members, then, if Google search volume was flat, we would expect no growth in the number of PDGA active members; and if Google search volume declined, we would expect to see a decline in the number of PDGA active members. Instead, what we see is that, if Google search volume is flat, the number of PDGA active members increases at a steady rate; if Google search volume increases, the rate of growth in the number of PDGA active members increases; and if Google search volume declines, the rate of growth of in the number of PDGA active members (but not necessarily the actual number of PDGA active members) declines.
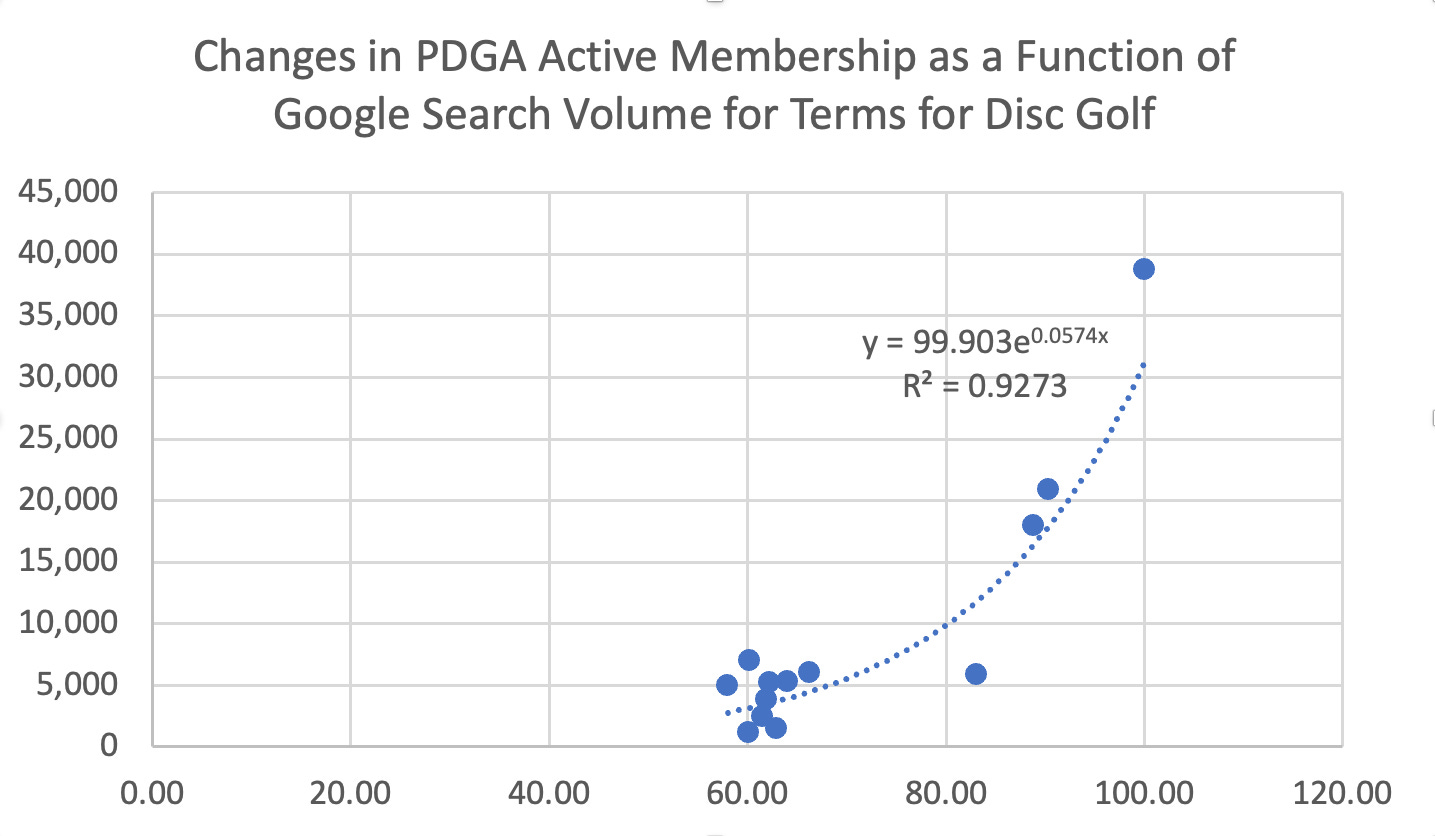
In fact, when I ran a regression analysis on the correlation between the volume of Google searches worldwide that included terms for disc golf and changes in the number of PDGA active members during 2011 to 2023, I was able the best fit with an exponential growth equation with an R² value of an impressive 0.9273, meaning that, using the equation, Google search volume from 2011 to 2023 explained almost 93% of the changes in the number of PDGA active members during that period. While I don’t think this equation will prove very accurate in predicting changes in the actual number of PDGA active members going forward, the very high R² value does support the existence of a close correlation between Google search volume and changes in the number of PDGA active members. This R² value is significantly higher than the best R² value that I was able to obtain for any equation for the relationship between Google search volume and the number (vs changes in the number) of PDGA active members.
Assuming that the percentage of all disc golf participants who are PDGA active members is fairly constant, the general relationship between the volume of Google searches worldwide that included terms for disc golf and the rate of growth in the number of PDGA active members should also hold true for the relationship between the volume of Google searches that included terms for disc golf and the rate of growth in the number of disc golf participants (i.e., the growth of disc golf). This probably means that:
a flat trendline for the volume of searches indicates a steady (not increasing or decreasing) rate of growth in participation (i.e. a steady rate of increase (or a steady rate of decrease) in the number of participants)
an increase in the volume of searches indicates an increase in the rate of growth of participation (i.e. an increasing rate of increase (or decreasing rate of decrease) in the number of participants)
a decrease in the volume of searches indicates a decrease in the rate of growth of participation (i.e. a decreasing rate of increase (or increasing rate of decrease) in the number of participants); whether a decrease in the volume of searches indicates an actual decline in the number of participants depends on how long and steep the decrease in search volume is
The next post will explore what the implications are of that relationship for the growth of disc golf based on recent trends in Google search volume that included terms for disc golf.